Digital Commonwealth — Boston Public Library
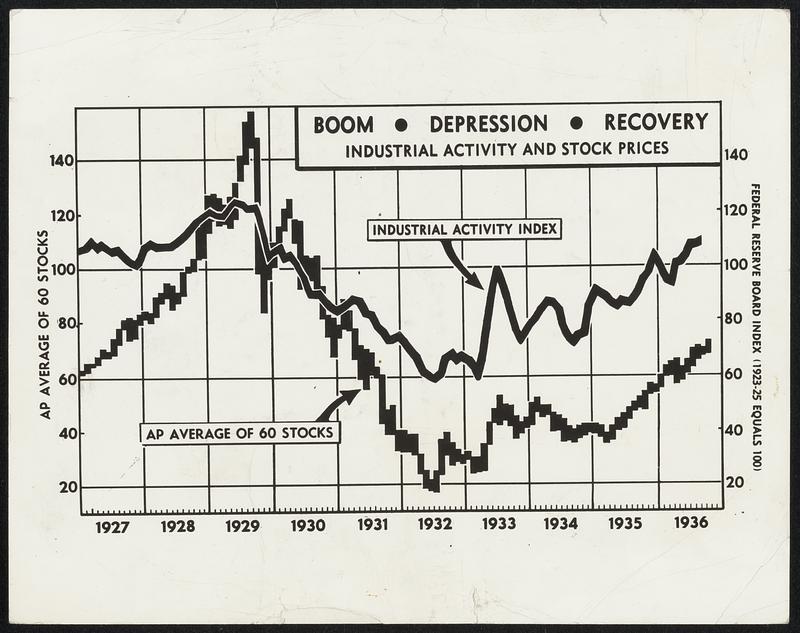
Ups and Downs of Stocks and Industry. New York. - Movements of Representative stocks and the comparative level of industrial activity are shown in this chart, which extends over seven “lean years” of the depression.
Associated Press · [ca. November 1936]
[Information from item housing] Industry & Manufacturing
🔒
Order museum-quality prints
Sign in to order prints, canvas, and more of this work. Browsing and full-resolution downloads stay free.