Digital Commonwealth — Boston Public Library
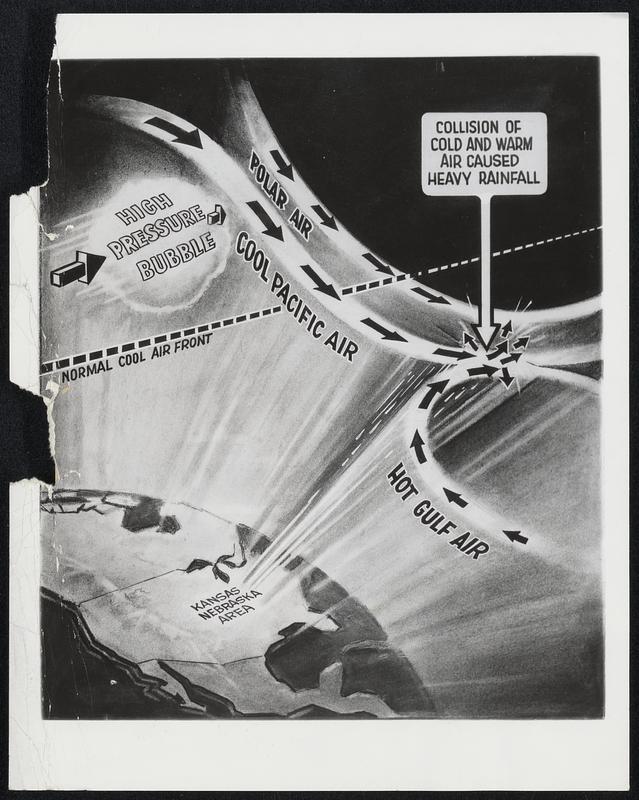
Then Came the Floods. This map shows how the weather that brought strange weather, including floods, to the nation this spring and summer was "born." It shows conditions two to six miles-above earth. The cold Pacific air moved southward and eastward with a front that was almost vertical, six to eight miles high. The dotted line shows where the cold air normally starts. The Jet Steam, as shown on the map, was narrower than it normally would be and traveling at great speed, above 200 miles an hour. Kansas City was directly under the narrowest part of this Jet Stream, and the area around there got the worst wetting.
Wide World Photos, Inc. · [ca. September 1951]
[Information from item housing] Weather: Misc: Wire Photos
🔒
Order museum-quality prints
Sign in to order prints, canvas, and more of this work. Browsing and full-resolution downloads stay free.