Digital Commonwealth — Boston Public Library
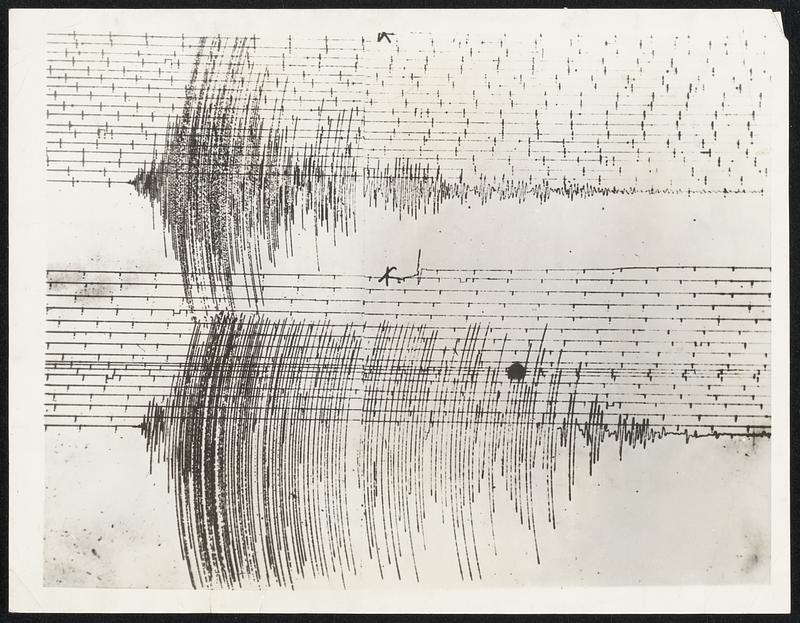
Seismograph Chart of California Earthquake -- This Seismograph Chart Photograph Showing How the Earthquake Which Shook Southern California Cities, March 10, Registered in East-West and North-South Movements, was Taken by Dr. Albert Newlin, Director of the Santa Clara University Observatory at Santa Clara, Calif. Top Graph Shows the East-West Movement, The "X" Indicating Approximately 6:37 P.M. The North-South Movement, by Far the Heavier and Longer, is Shown in Lower Graph. The "X", Registering 6:37 P.M., Shows This Movement Kept Up For Nearly 80 Minutes Before Subsiding.
Associated Press · [ca. March 1933]
[Information from item housing] Earthquake - Calif. Misc.
🔒
Order museum-quality prints
Sign in to order prints, canvas, and more of this work. Browsing and full-resolution downloads stay free.