Digital Commonwealth — Boston Public Library
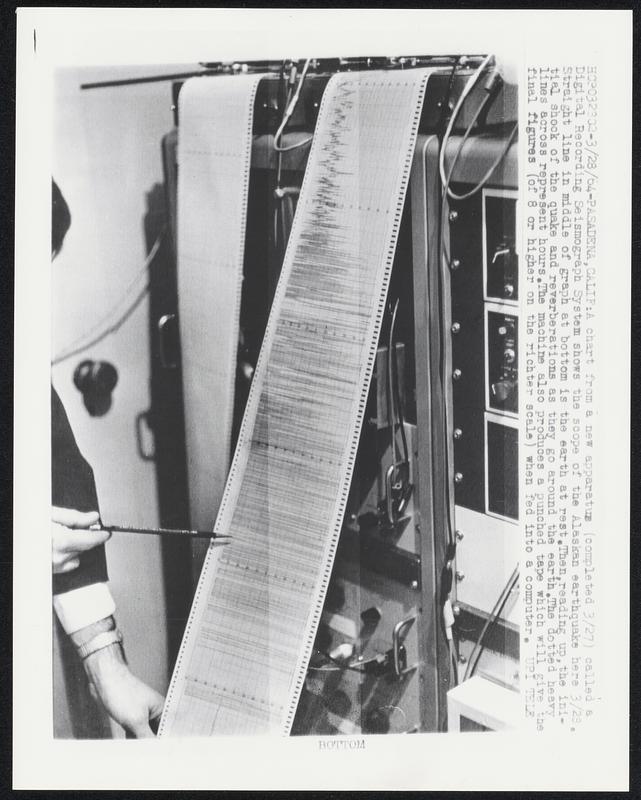
A chart from a new apparatus (completed 3/27) called a Digital Recording Seismograph System shows the scope of the Alaskan earthquake here 3/23. Straight line in middle of graph at bottom is the earth at rest. Then, reading up, the initial shock of the quake and reverberations as they go around the earth. The dotted heavy lines across represent hours. The machine also produces a punched tape which will give the final figures (of 8 or higher on the richter scale) when fed into a computer.
United Press International · [ca. March 1964]
[Information from item housing] Earthquake Alaska 1964
🔒
Order museum-quality prints
Sign in to order prints, canvas, and more of this work. Browsing and full-resolution downloads stay free.